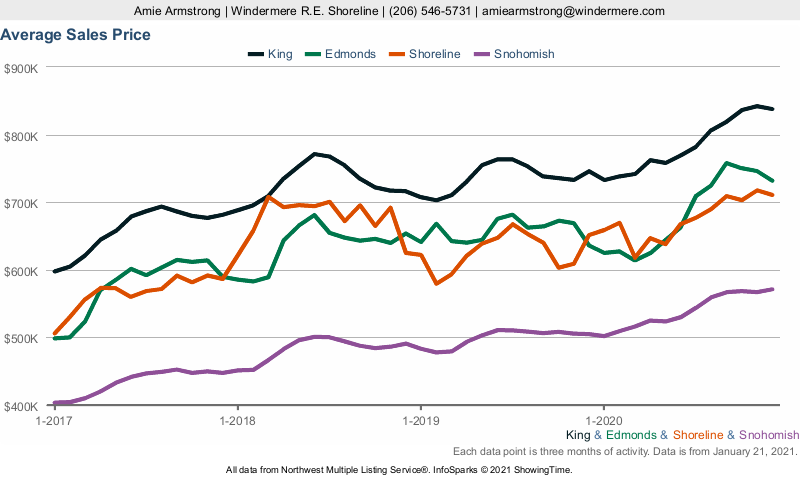
This graph shows residential and condominium sales for the past 3 years using a 3-month rolling average calculation.