Facebook
 X
X
 Pinterest
 Copy Link
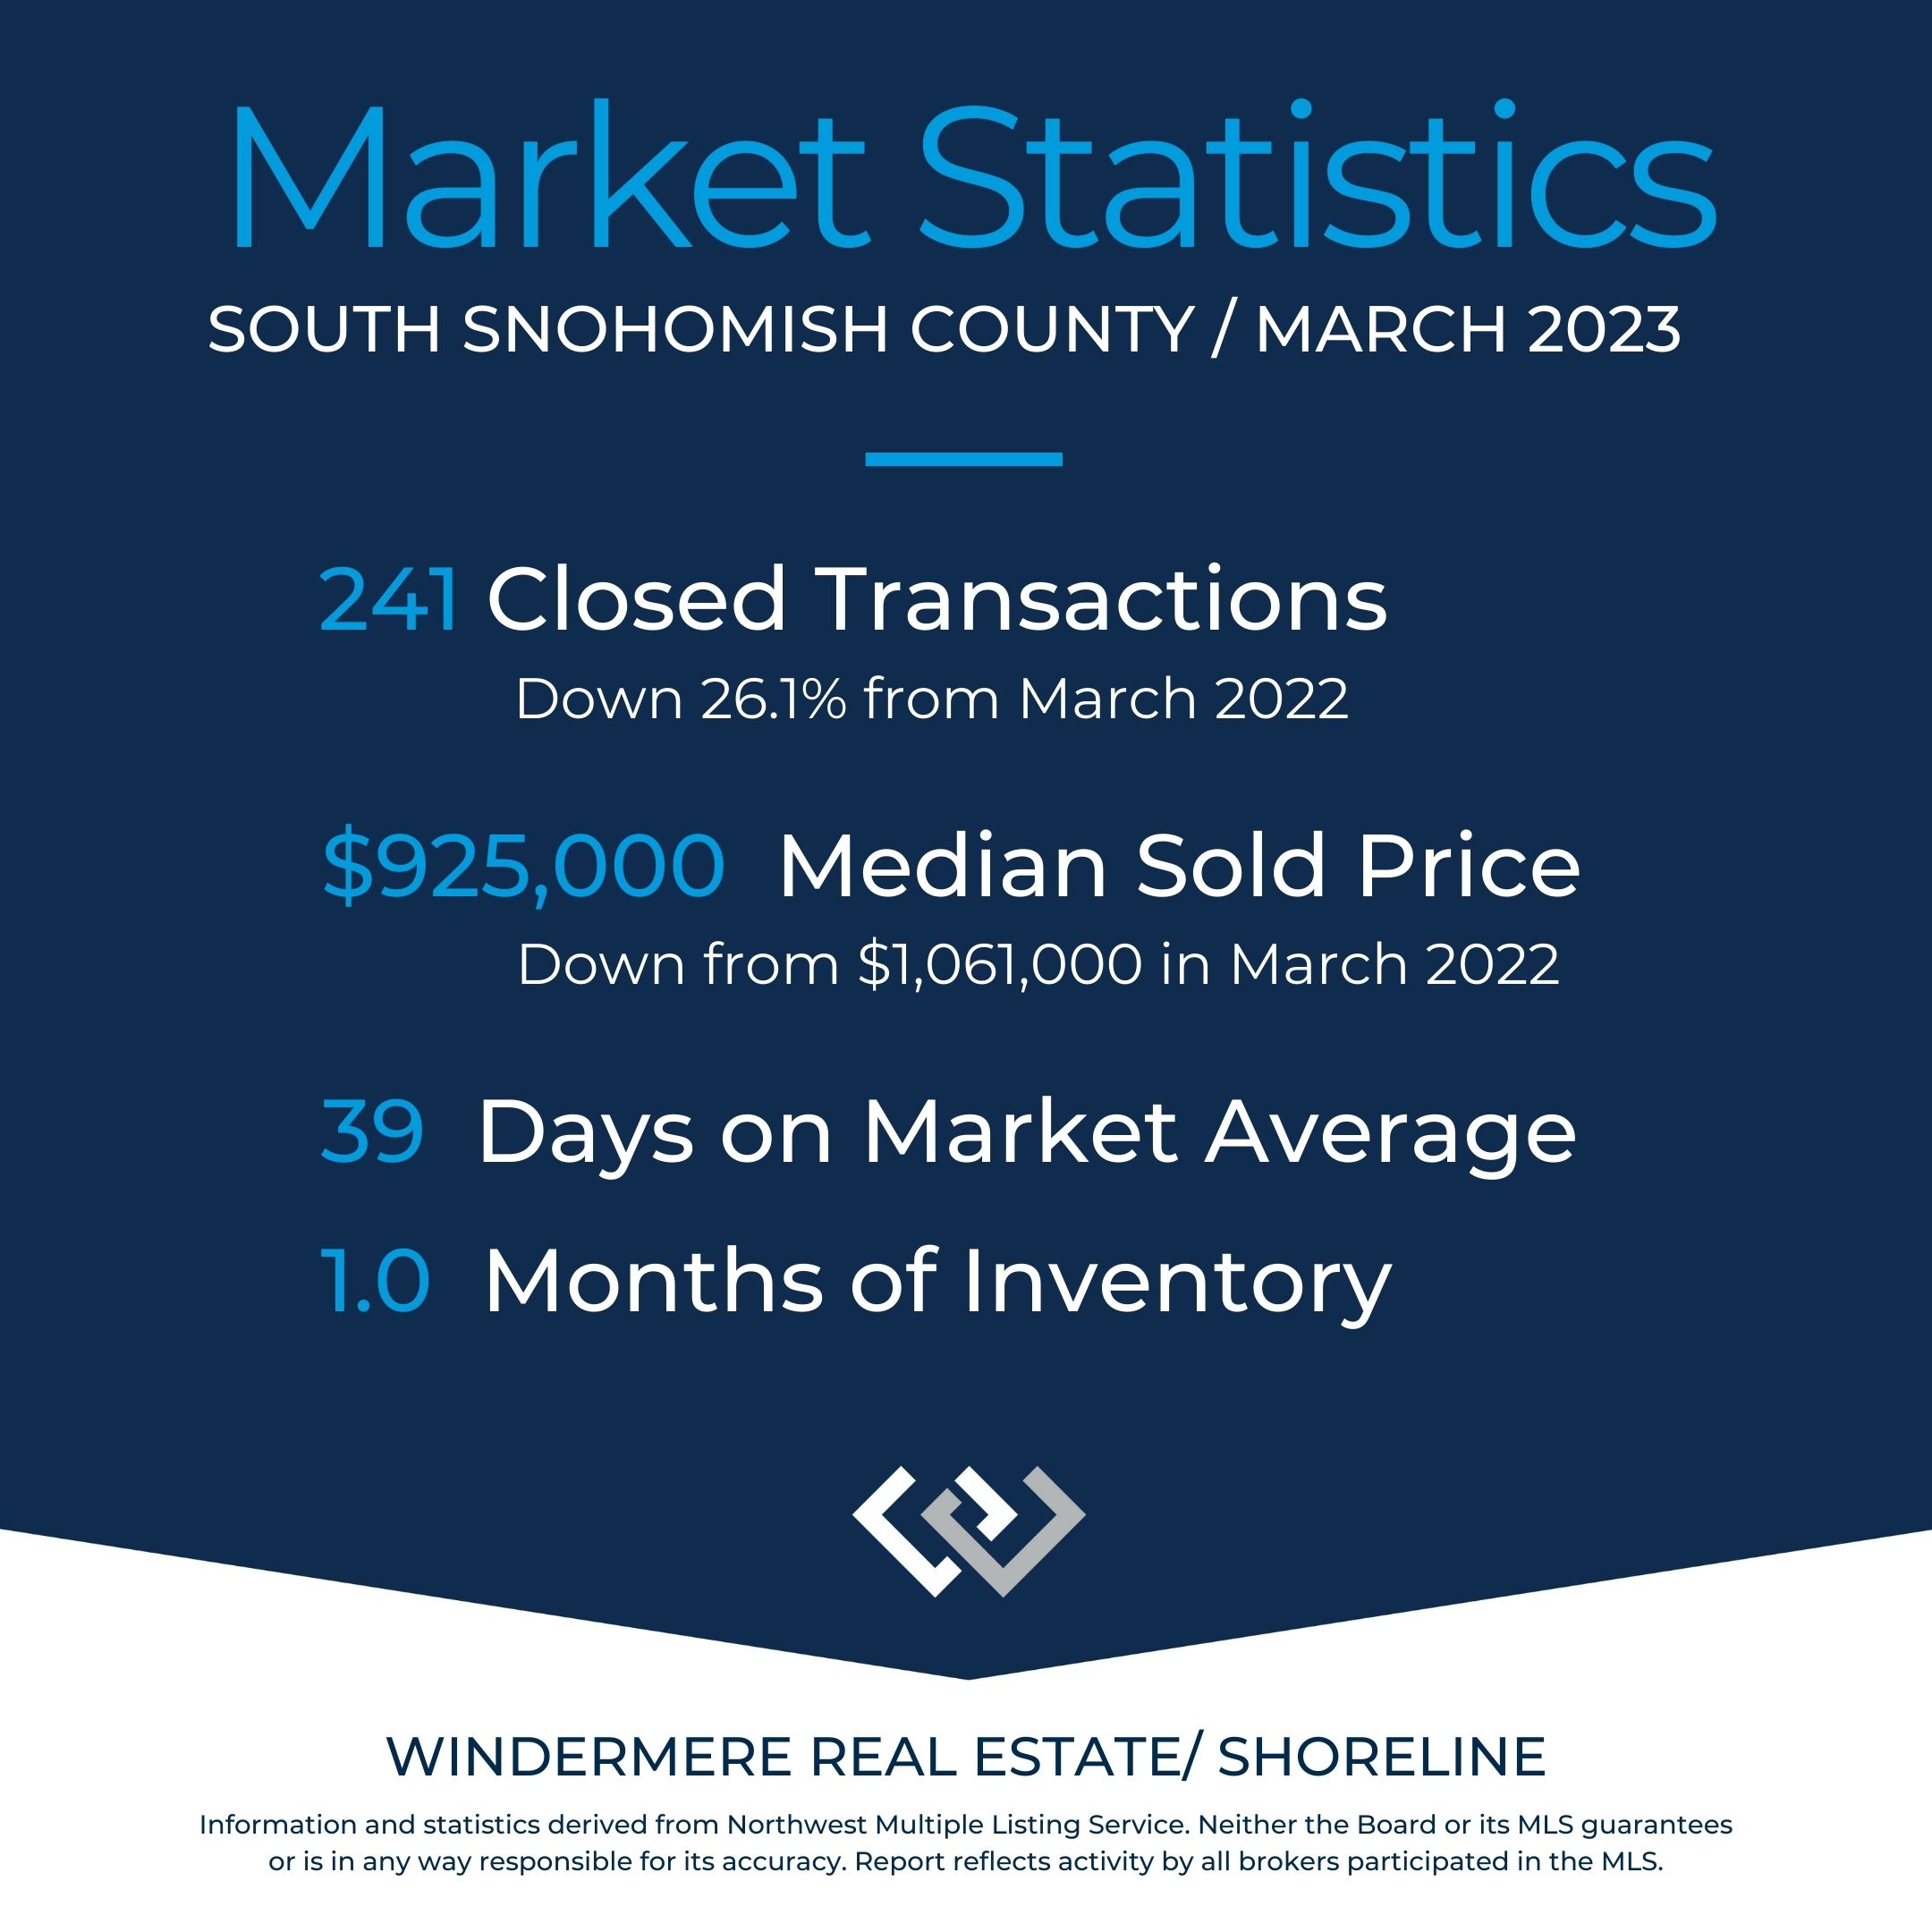
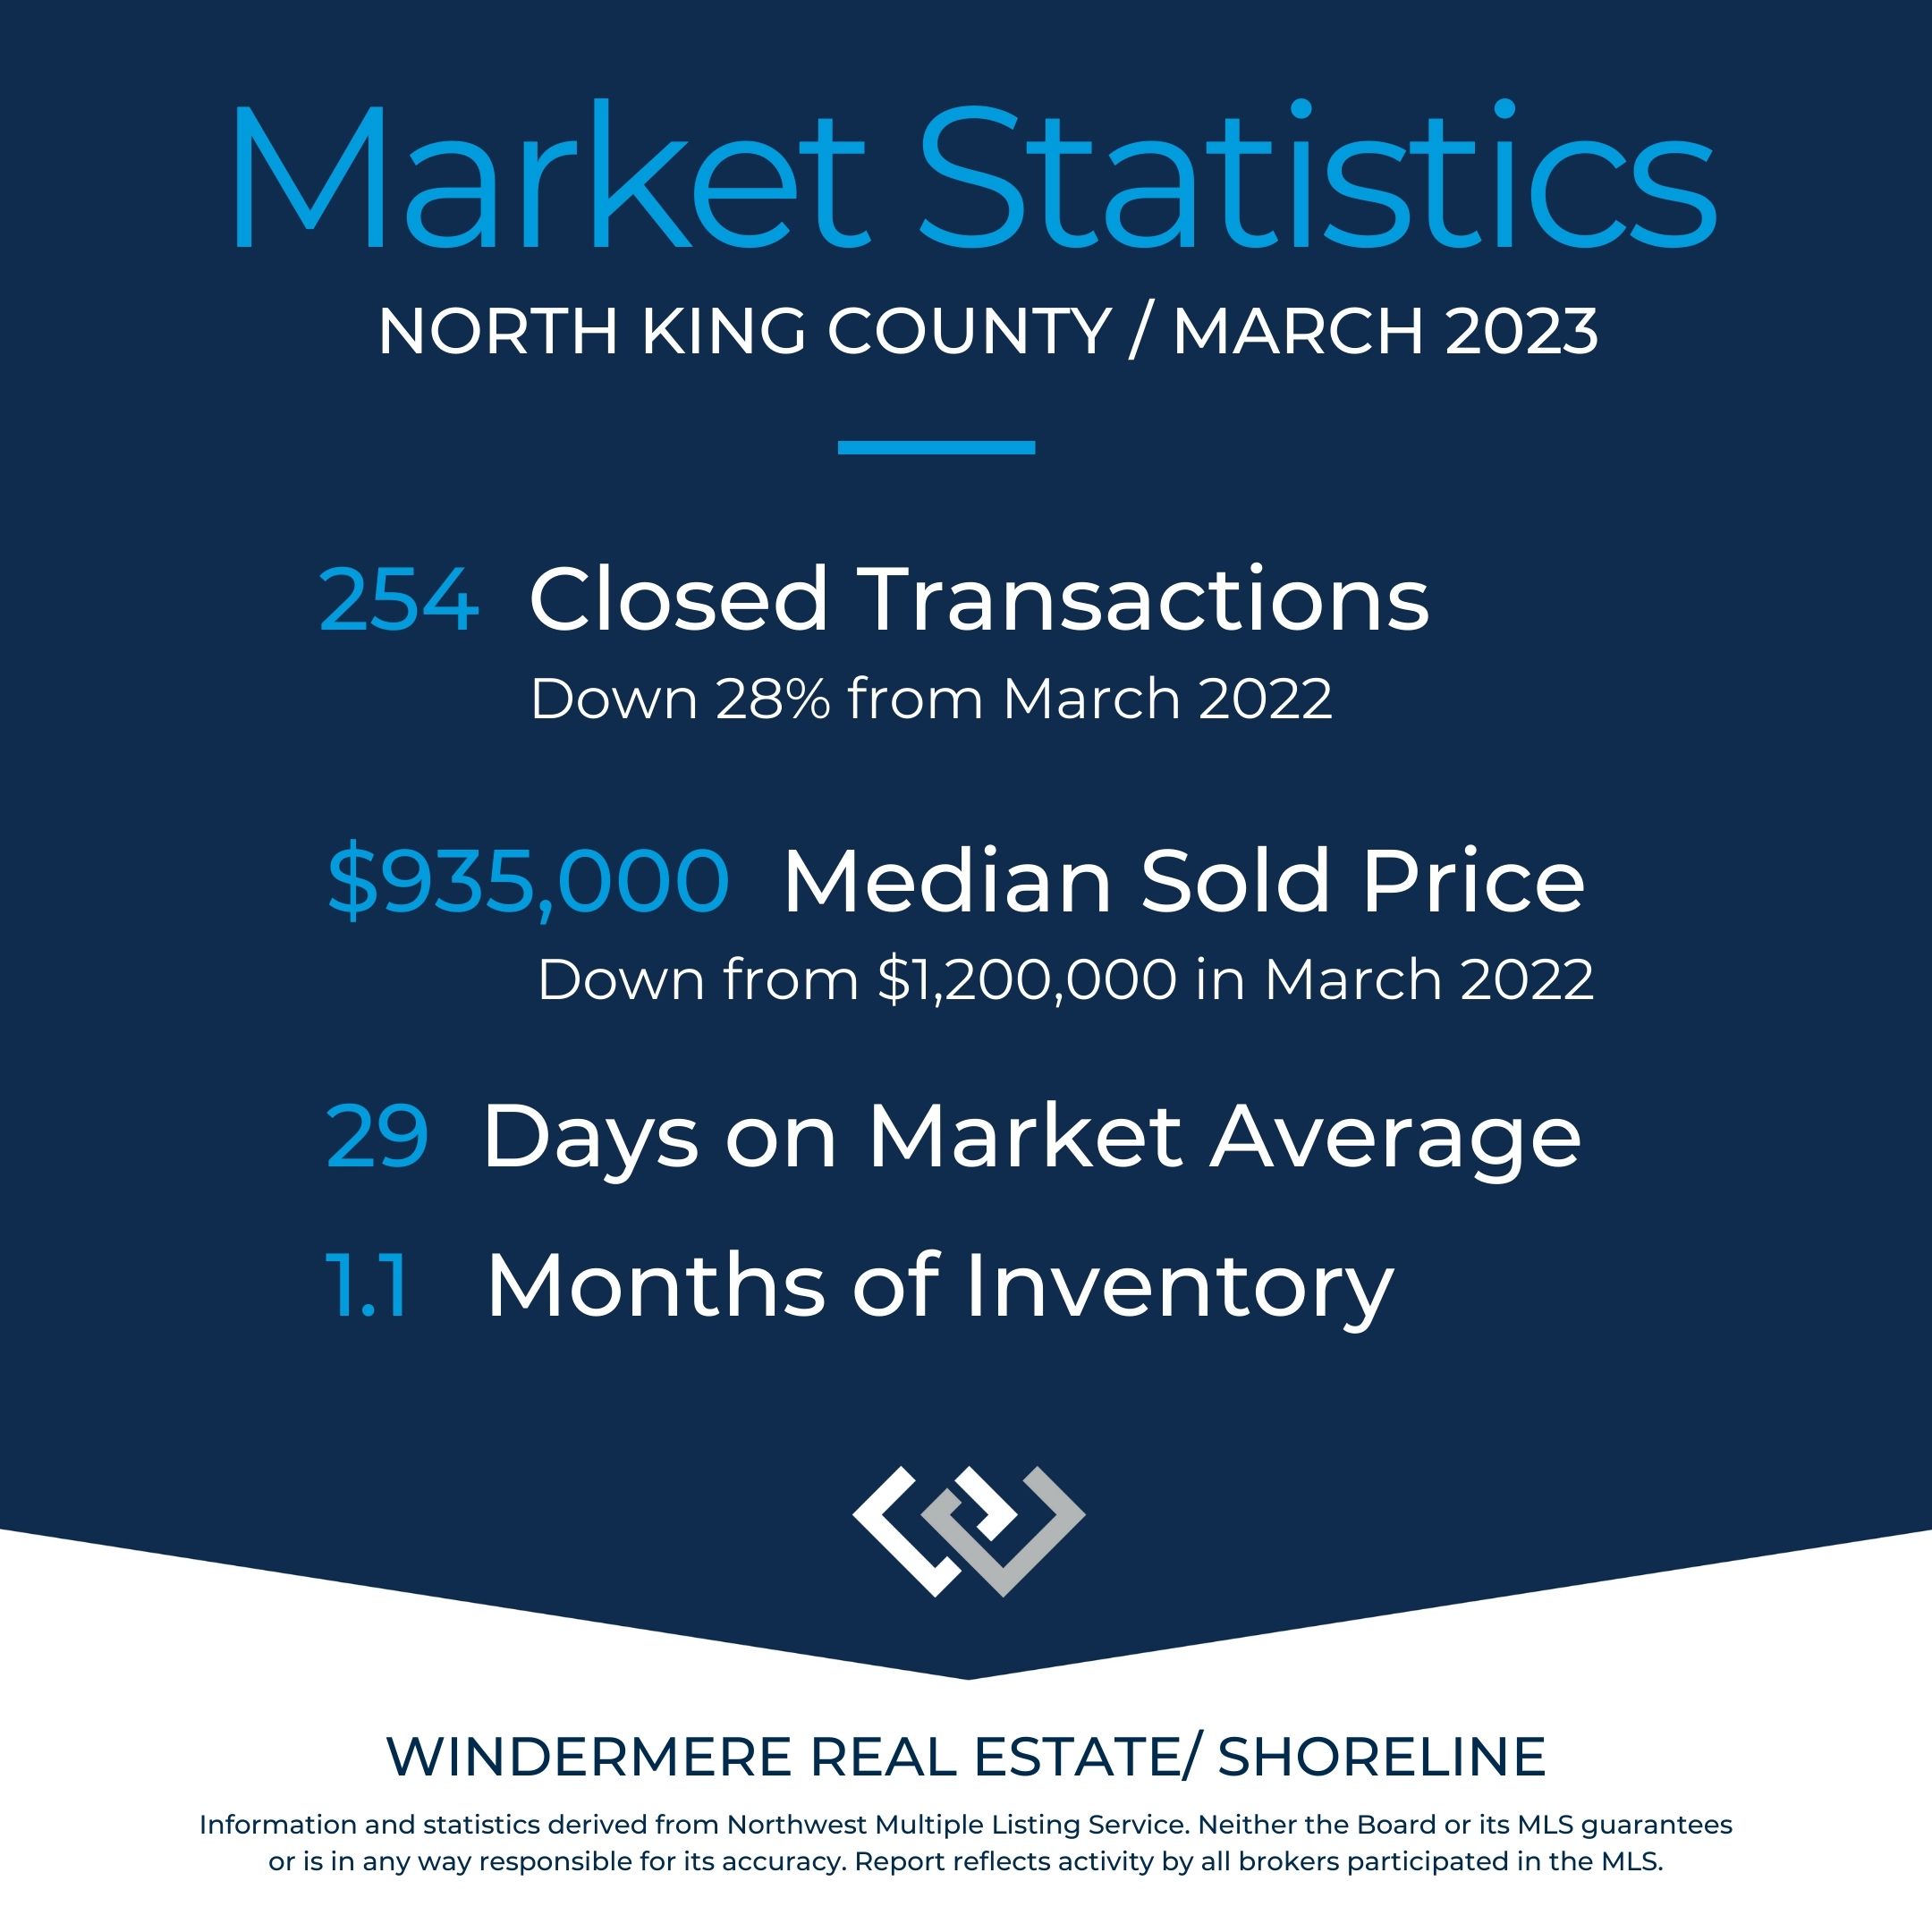
There is a lot of information in the latest real estate market statistics! Here are the highlights for the period ending March 31, 2023:
1. Sales volume is down considerably from one year ago. Volume has dropped from the low 20’s to low 30 percentage points depending on area. Sales volume represents the number of homes sold.
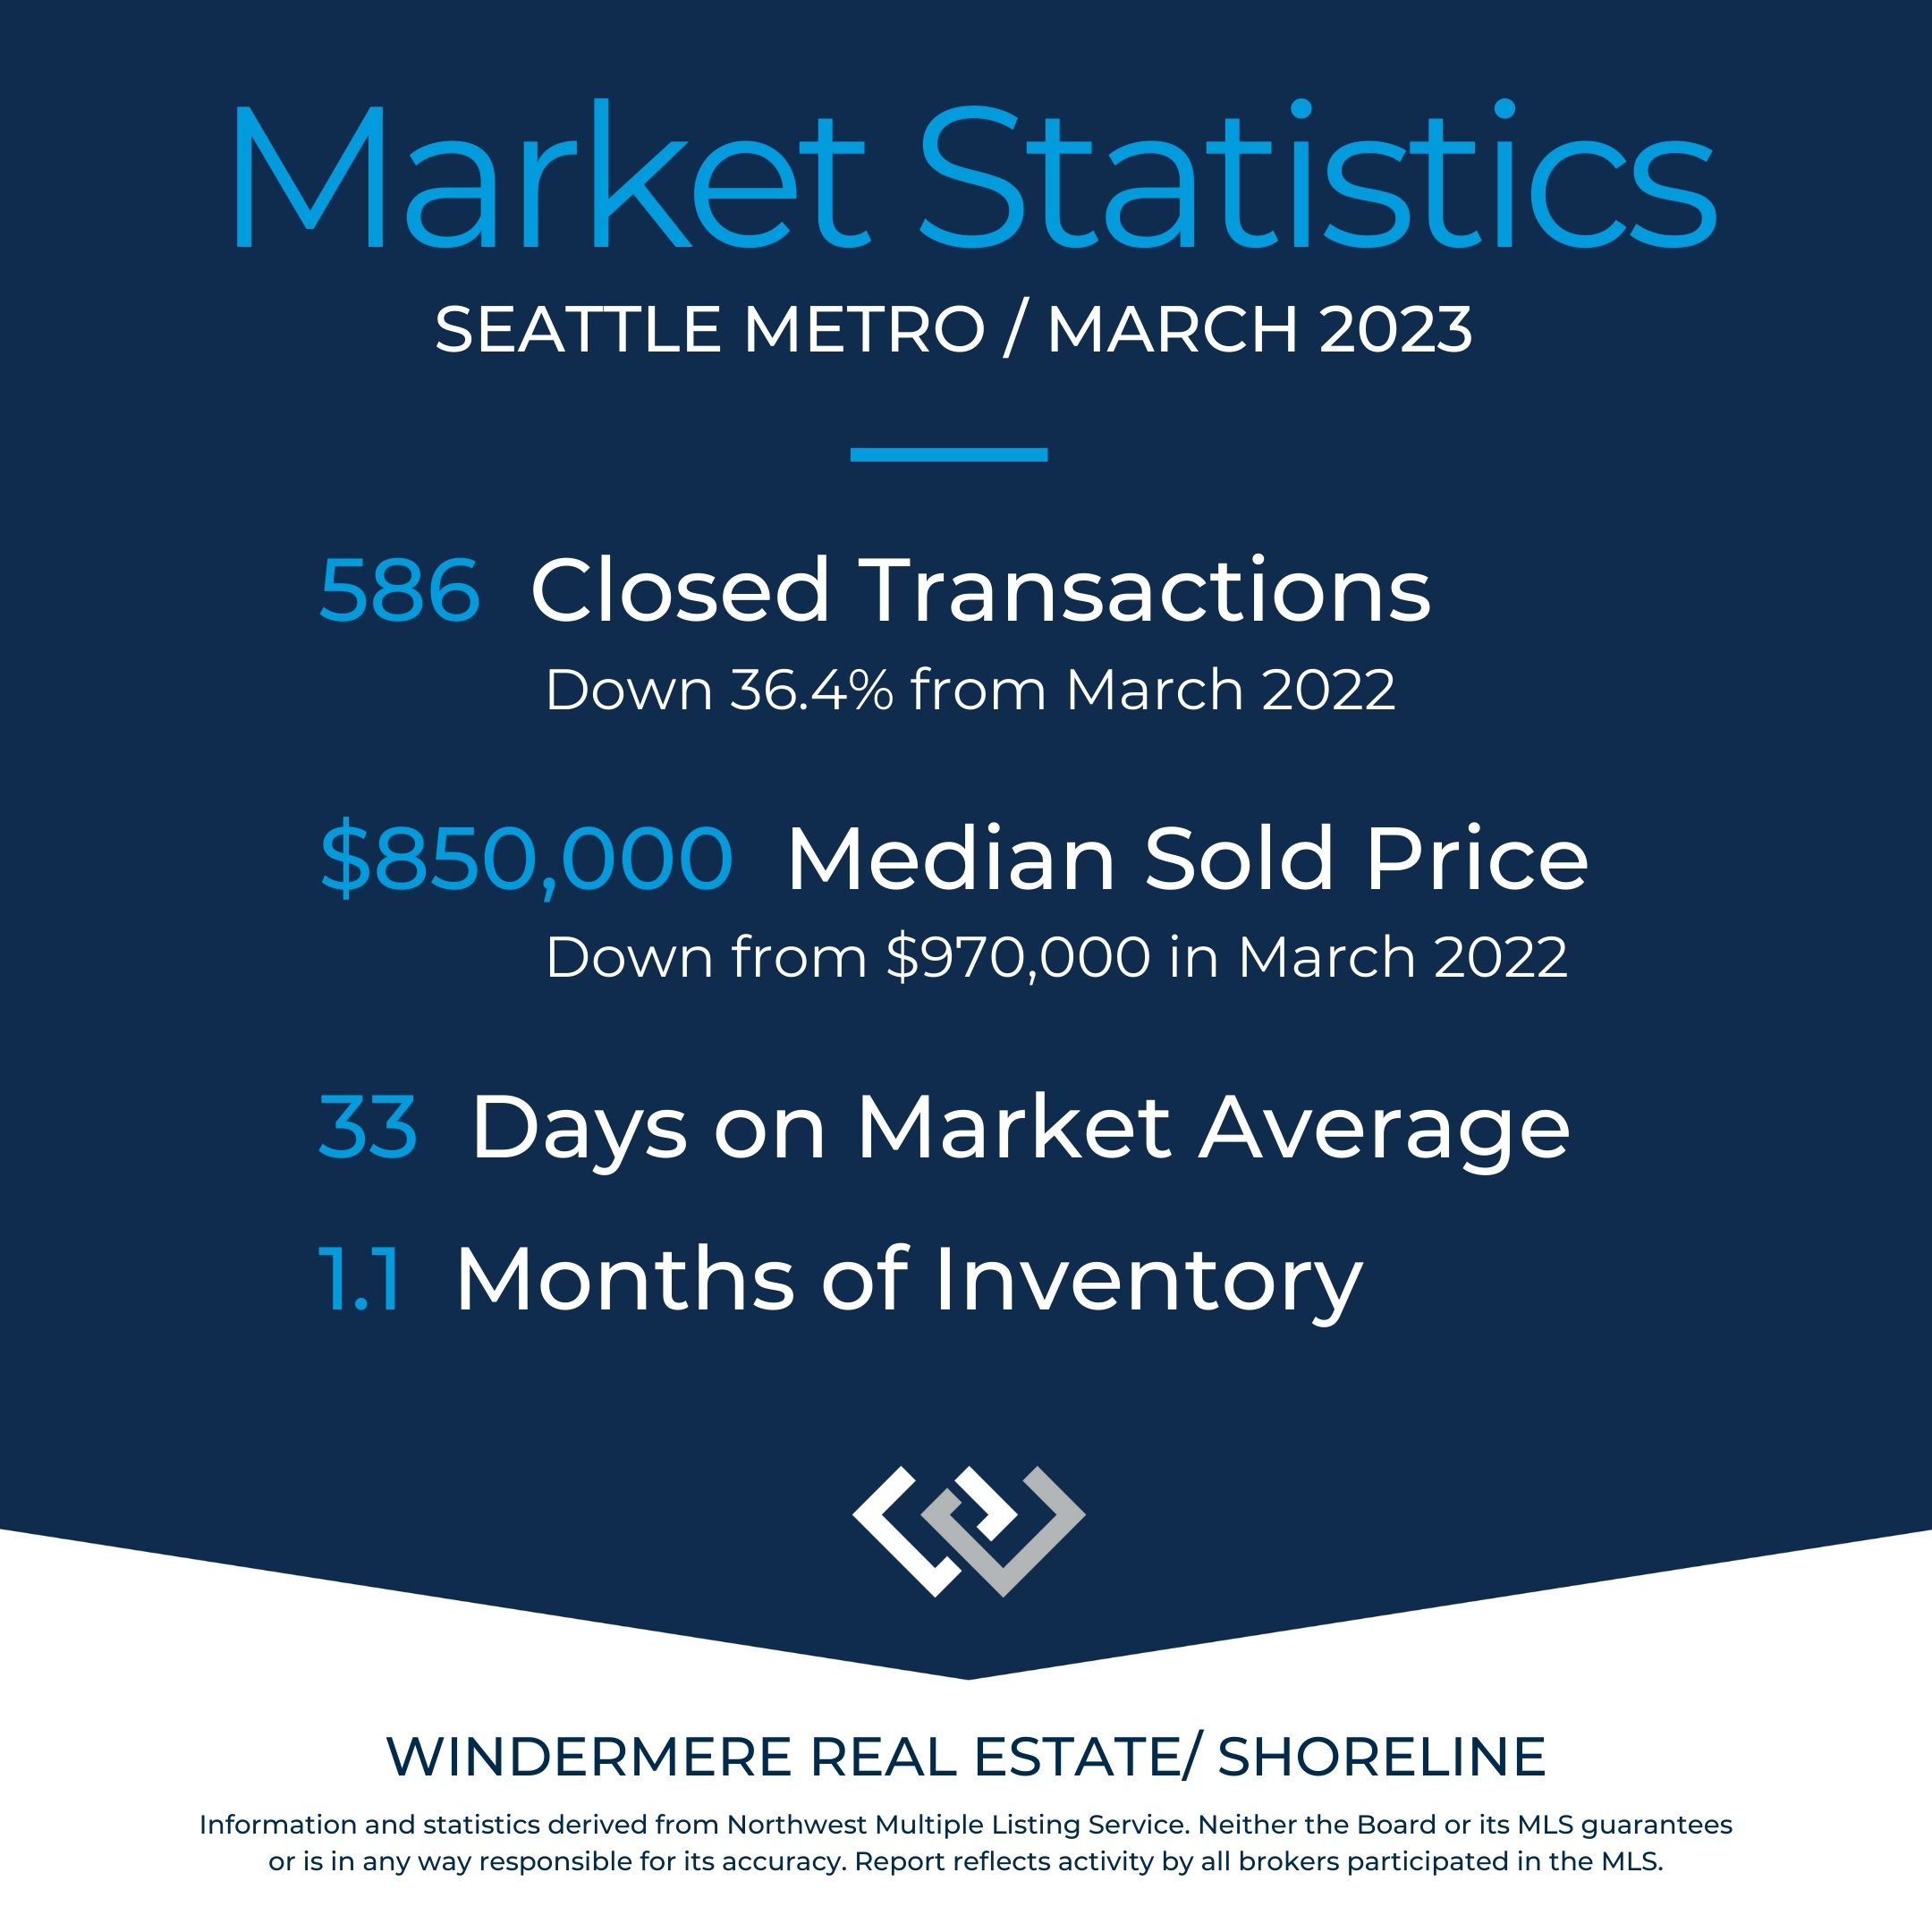
2. Sales Prices, both average and median, are down for South Snohomish, North King, Seattle METRO, and the Eastside areas compared to last year.
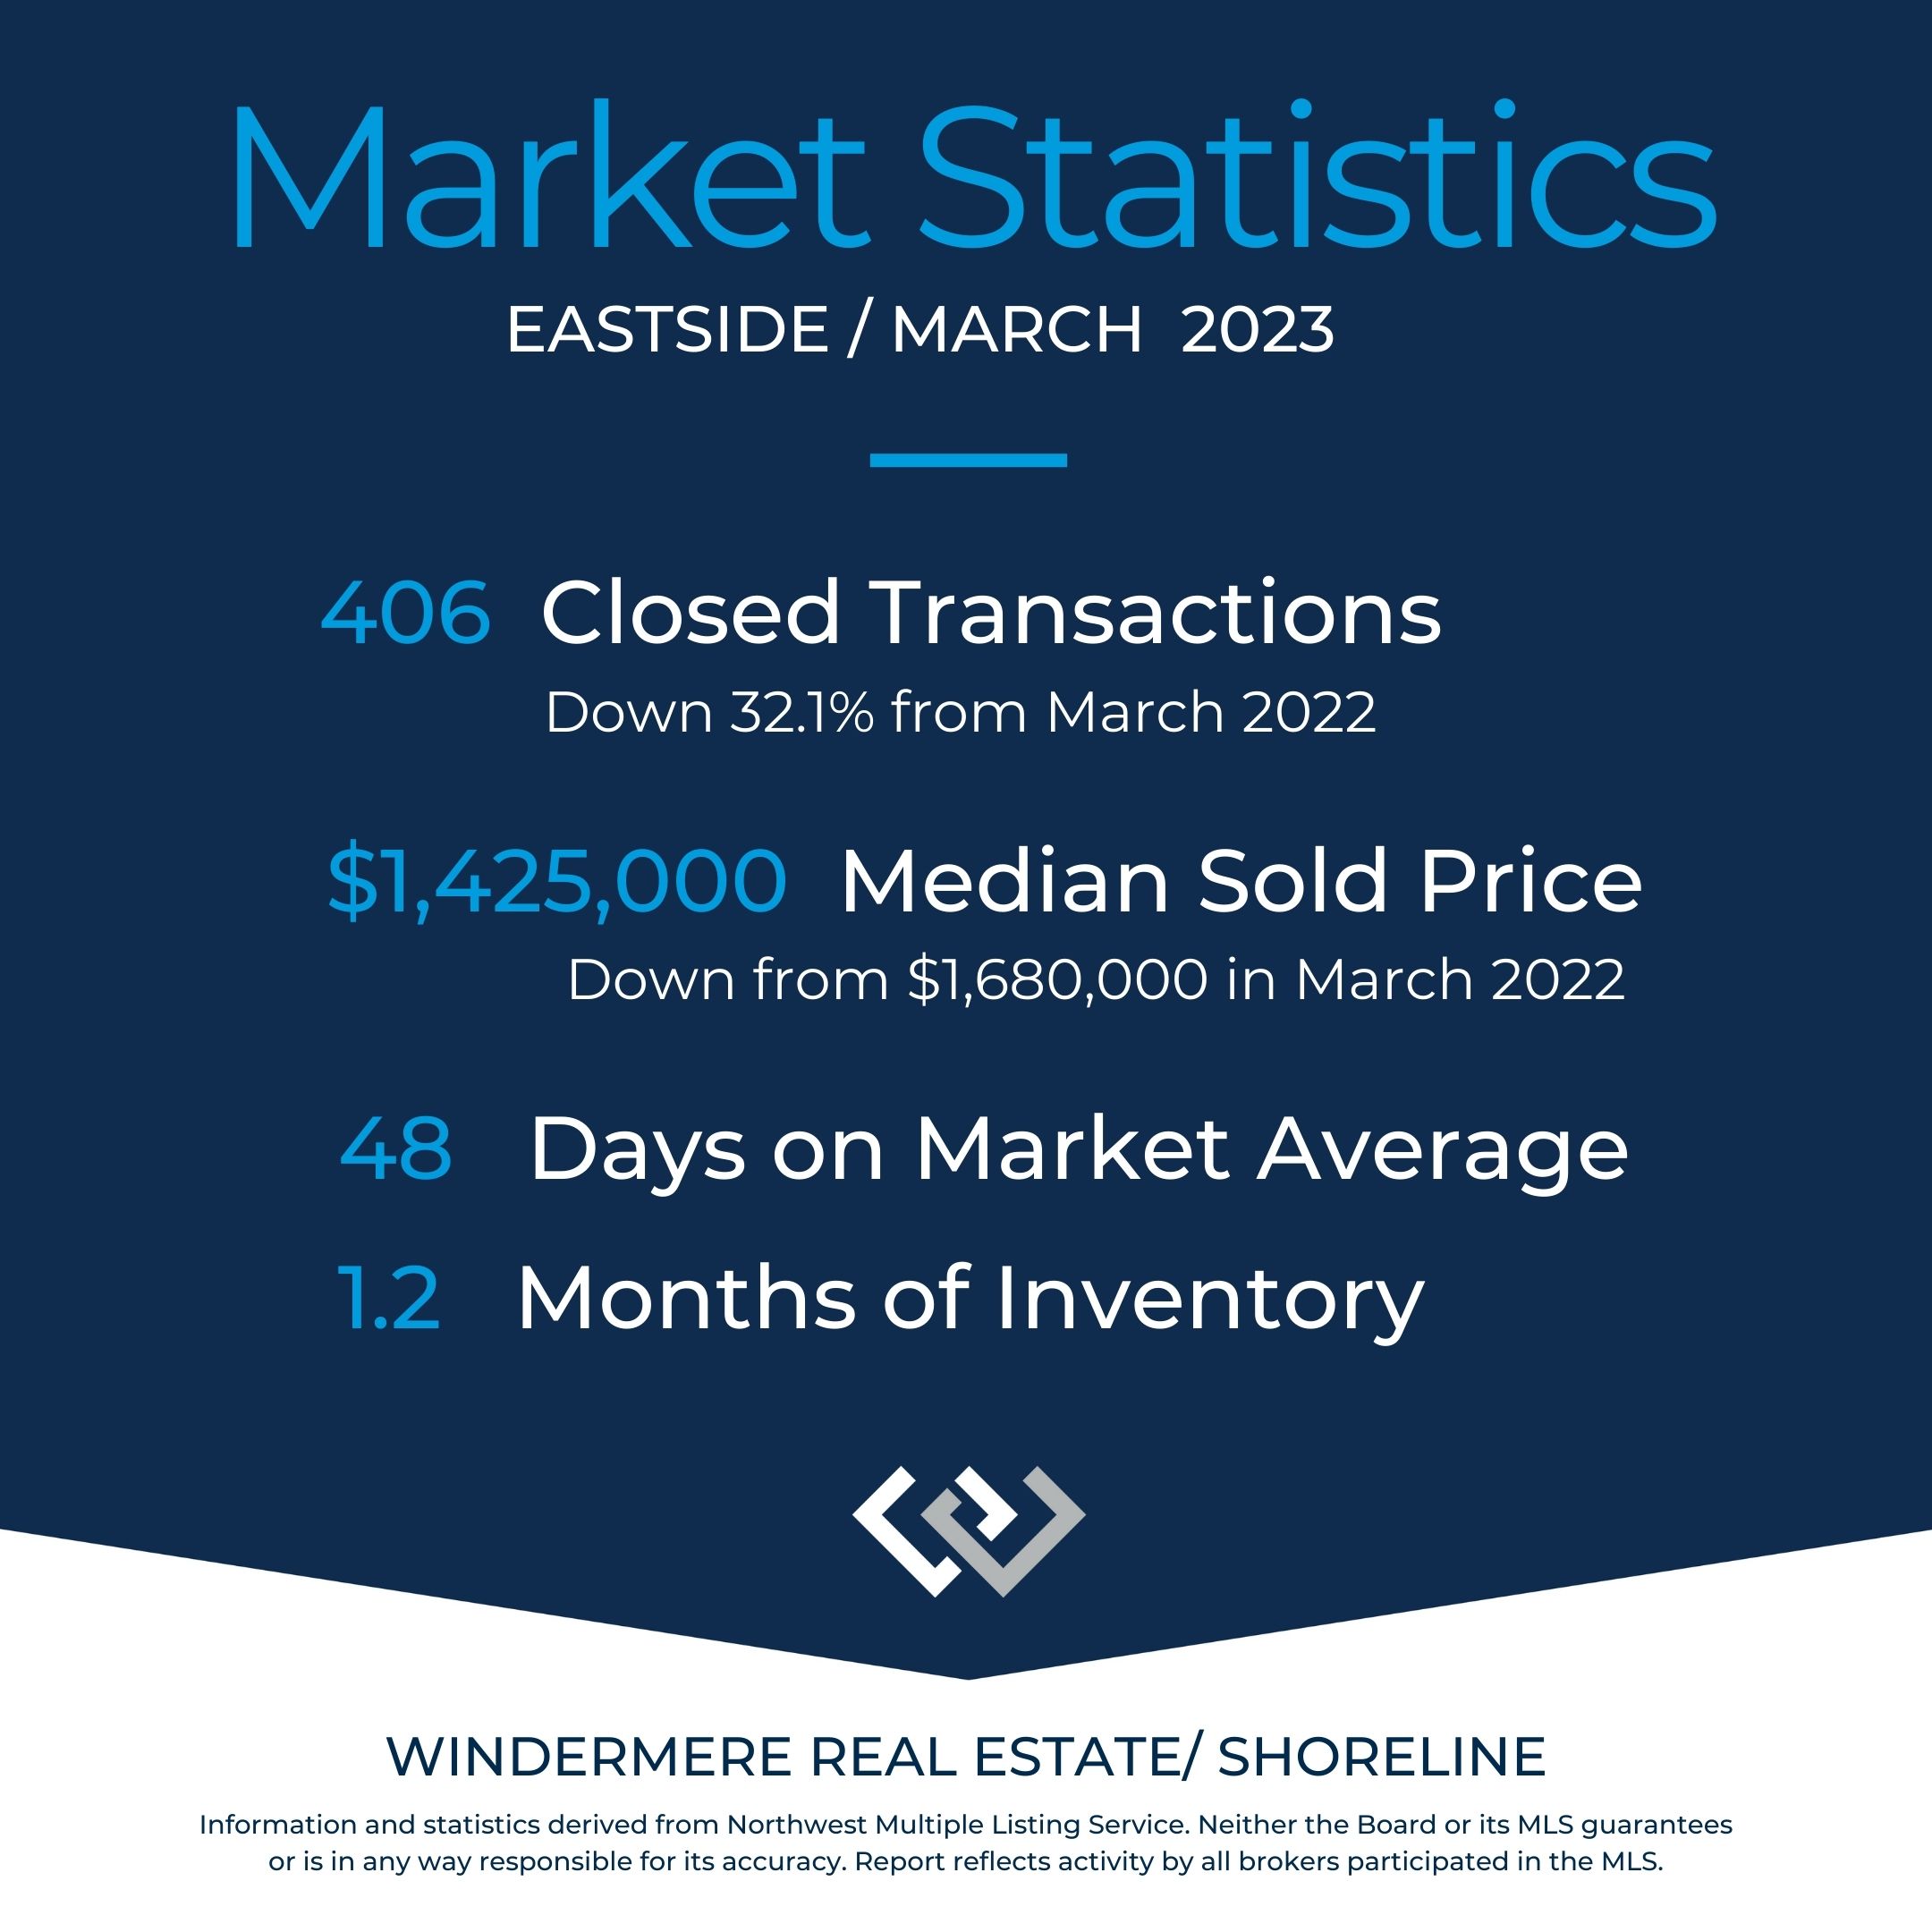
3. The Eastside had 32.1% fewer transactions and the median sales price dropped 17.9% compared to one year ago (see date below). The Eastside is, notably, the area that saw the biggest increase over the past several years. It makes sense that this area would see the bigger drop. The Seattle Metro area, while not having as large of a drop in median sales price, had an even larger drop in volume: 36.4% compared to March 2022 (see chart below).
4. Not shown in the data: Market activity has been increasing since late January especially as interest rates have come down slightly. Median sales prices are UP since January: King county +5%, Metro: +6%, Snohomish County + 3%, N. King +10%, S. Snohomish +4.6% Average days on market (CDOM) are shortening, indicating the pace of sales is quickening. Since January 2023, CDOMs have decreased: King County -20%, Metro -27%, Snohomish County -16%, N. King -36%, S. Snohomish County -7%. List/Sales prices are increasing, meaning, sellers are getting closer to their asking price: King County 98%, Metro 99%, Snohomish County 98%, N. King 100%, and S. Snohomish County 97%. Finally, inventory levels are lessening, meaning it if no new homes became available for sale, active listings would be gone more quickly. The number of months of inventory is, traditionally, what is used to describe they type of market we have: Buyer’s (6+ months), Seller’s (0-3 months), or Balanced Market (3-6 months) of inventory.
5. Currently we are in a Seller’s Market because inventory levels for all areas shown range from between 0.9 to 1 month at the end of March 2023. With the uptick in demand, decrease in interest rates, and increasing LP/SP ratios, we are seeing more multiple offer situations. The competition is not as intense as in the past few years; when there are multiple offer situations there are usually a handful or two of offers compared to double digit numbers before. To illustrate this shift, during the week of 4/2-4/8 a condo in Edmonds was listed for sale and was pending 4 days later. It escalated around $70k (the LA wouldn’t give me an exact figure), receiving seven offers, four of which were cash. Most waived inspection altogether, nobody pre-inspected, and none was provided. My most recent sale in North Seattle that closed on 4/7 is another example: It received four offers, all financed, and escalated $30k over asking price. At the end of March 2023 market time in the areas listed was between 29-48 days. Properties that are prepared and priced well are getting snatched up with multiple offers while others are sitting . Careful preparation and pricing are critical for seller success!
6. Sometimes sales prices don’t make sense! The Edmonds “Pending” condominium is a prime example of this. Looking at comparable sales nearby, on paper this property should not be pending sale for this much. Buyers and sellers often ask me, “How much will this property sell for?” My honest answer is often, “I really don’t know.” Clients hate hearing this! But it’s the truth. What I can say is what a property could appraise for, and maybe what it should sell for based solely on the comps. However, that is not necessarily what it will sell for. The final sales price will ultimately will depend on the specific buyer(s) on a particular day with that specific property, and what the sellers are willing to sell for. It is worth restating: Properties that are well prepared, presented, and priced are the ones that tend to sell the fastest, for the most money, and often with the best terms. This I can say!
7. Interest rates and low inventory have been the driving factors in our real estate market. Ongoing low inventory has put upward pressure on prices, while higher interest rates have reduced purchasing power and put downward pressure on prices. I do not see the low inventory situation changing any time soon (probably for years). Additionally, minor shifts in interest rates have been having a significant impact on buyer demand from week to week because they have a great impact on buyers’ purchasing power. Buyers (especially first-time) are acutely sensitive to interest rate shifts.
8. First-time home buyers and properties at lower price points have been most affected by the rising interest rates. The ongoing shortage of homes will put continued upward pressure on prices and will probably result in (I hate to say it) more bidding wars, especially for cream puff properties. Until we build more affordable homes, we will probably stay in a seller’s market, traditionally defined as inventory of less than 3 months, depending on who you ask.
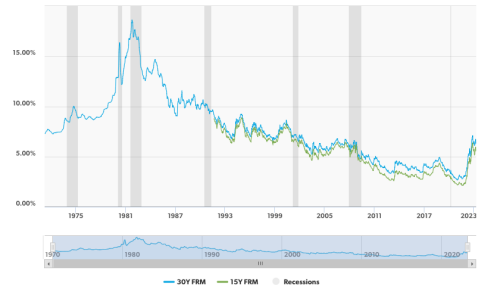
9. Mortgage rates (see chart below) are well below their historical average of 7.75%. Over the past few years, we have been spoiled with ridiculously low rates. As of 4/10/2023, according to Mortgage News Daily and the Mortgage Banker’s Association weekly survey, the average 30 year FHA mortgage rate is 6.17%. Many experts expect interest rates to come down slightly as the year progresses (barring unforeseen world events like a pandemic, debt ceiling default, war, etc. You know, the usual stuff). Frankly, nobody really knows what will happen going forward. I don’t really like crystal balls because you can end up with a mouthful of glass.
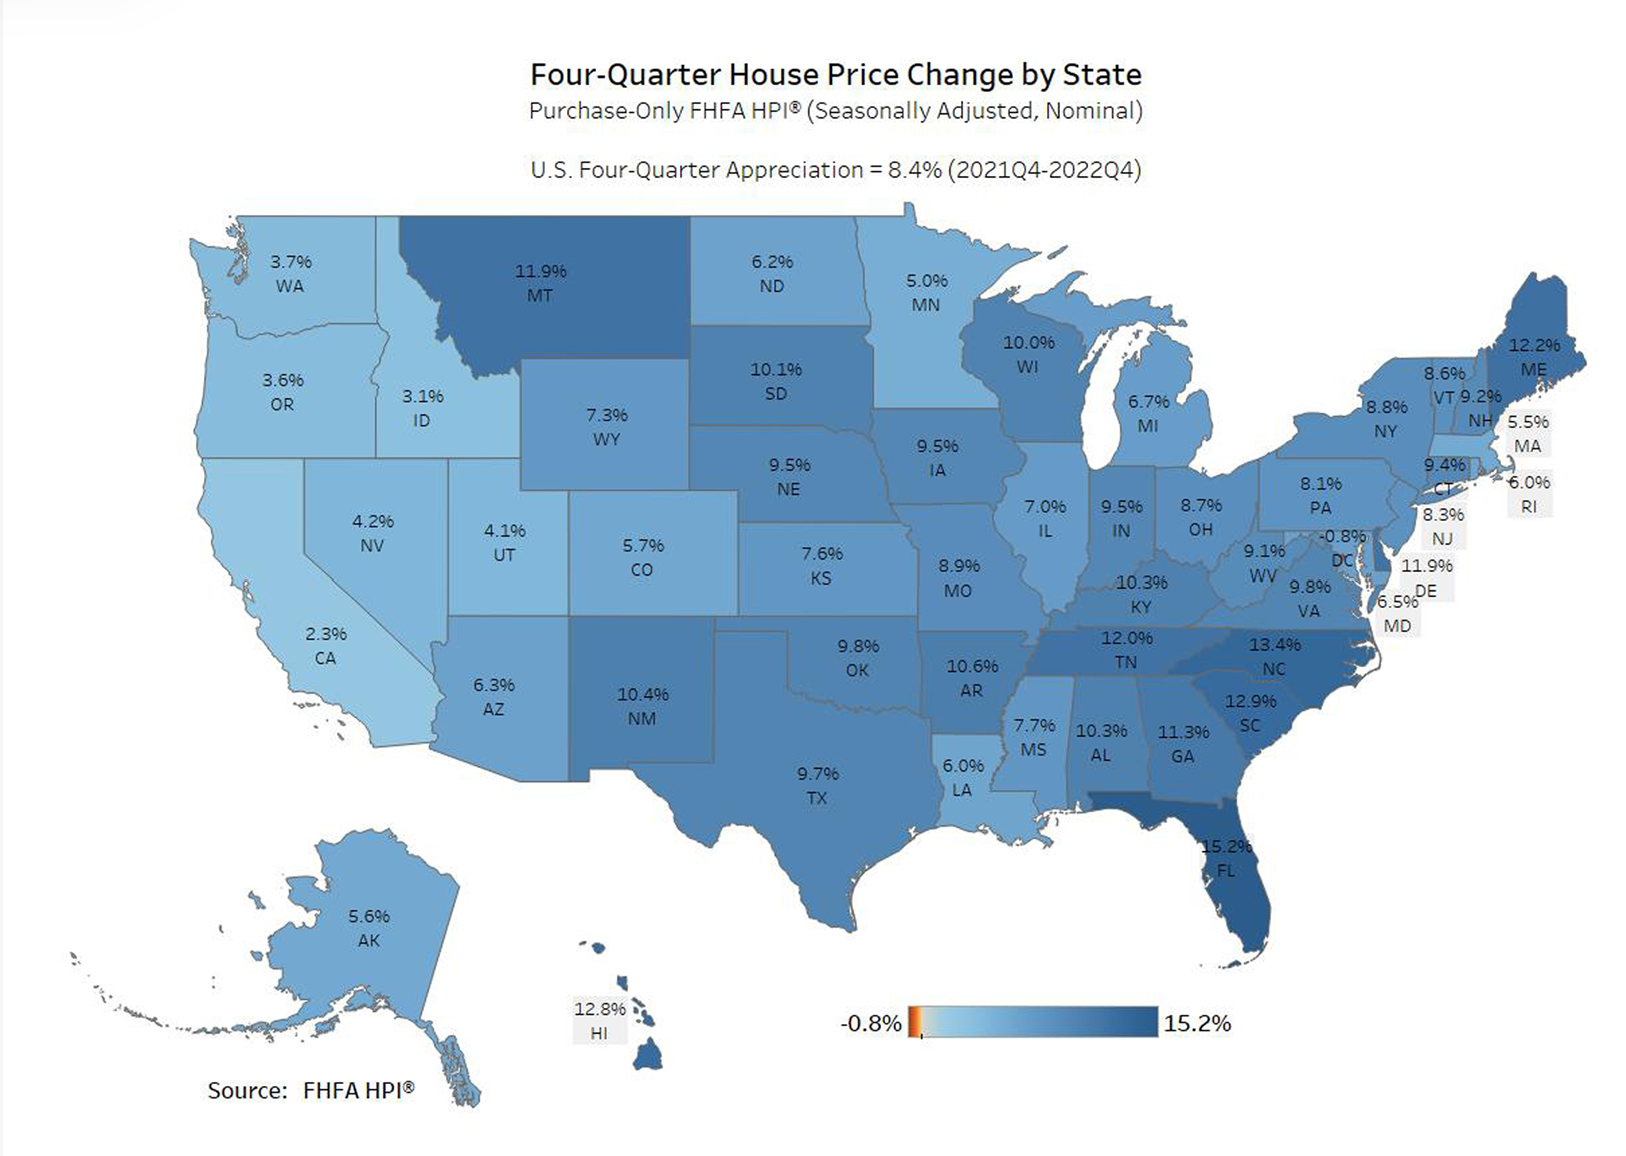
10. Finally, it’s interesting to note that for the one-year period Q4 2022-Q4 2023 the eastern half of the U.S., particularly the SE in Florida and the Carolinas, saw significantly more housing price appreciation than the west coast. Experts are not in complete agreement as to why, however generally speaking the areas that saw the largest housing price gains have seen the biggest slowdowns. It will be interesting to see what happens going forward.
Note: the figures published on this map are for the state as a whole, so the statistics may or may not be applicable to your particular area.
If you have any questions or would like further information/detail, please reach out! I will provide expert guidance as you navigate the management of what is likely (or will be!) your largest asset: Your Home.